Observability your agents can operate.
Send OpenTelemetry to one binary. Investigate with Pitot's built-in agent, or connect yours over MCP.
v2026.11.0-alpha: 507,311 accepted items per second on average over 306.8 seconds: 61,571 spans, 224,112 log records and 221,628 metric points per second. Stacked areas show trailing five-second rates from Pitot's accepted-row counters, starting with the first full window. Measured mixed-sustained trial.
Replay of the measured run · Hetzner ccx33 · 8 vCPUHow we measured →
- MCP for your agents
- OTLP traces, logs and metrics
- Parquet you own
- Apache-2.0
Dashboards from a sentence.
Section titled “Dashboards from a sentence.”Ask for the whole store’s request rate, errors and p95 latency by service, its dependency map, slowest operations, recent errors and slowest traces. The agent checks every panel, then saves the dashboard.
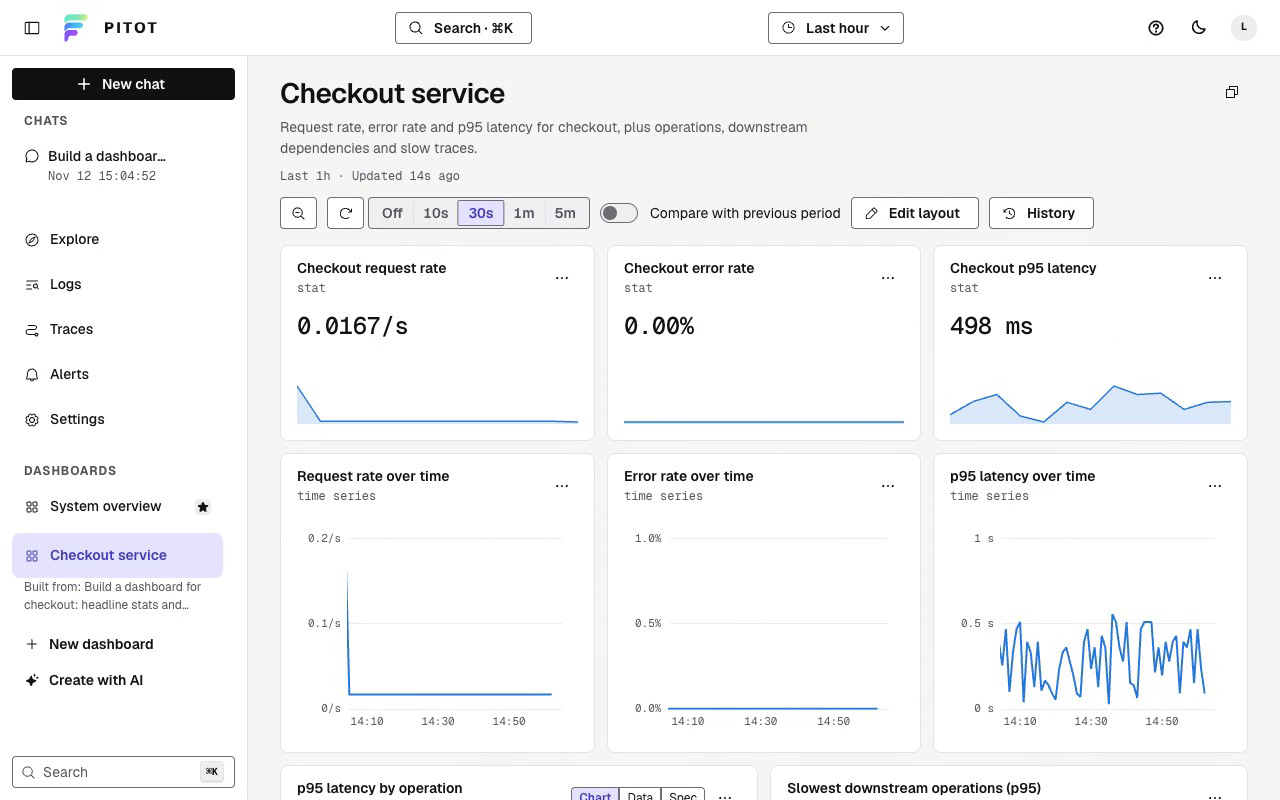
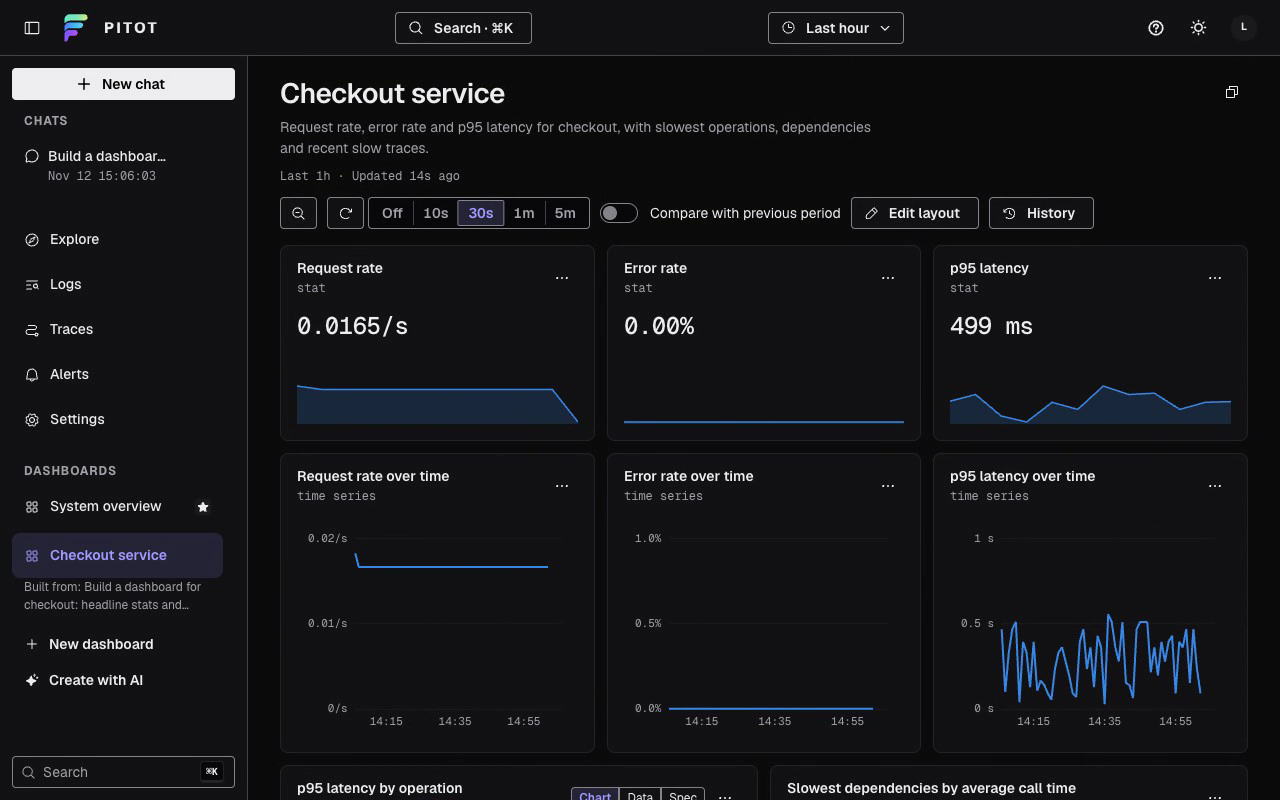
A one-sentence request becomes a saved eleven-panel dashboard: request rate, error rate, p95 latency and error log stats, by-service time series, a service dependency map, slowest operations, recent error logs and slowest traces.
Ask what broke.
Section titled “Ask what broke.”The agent queries traces, logs and metrics, then explains what the evidence shows.
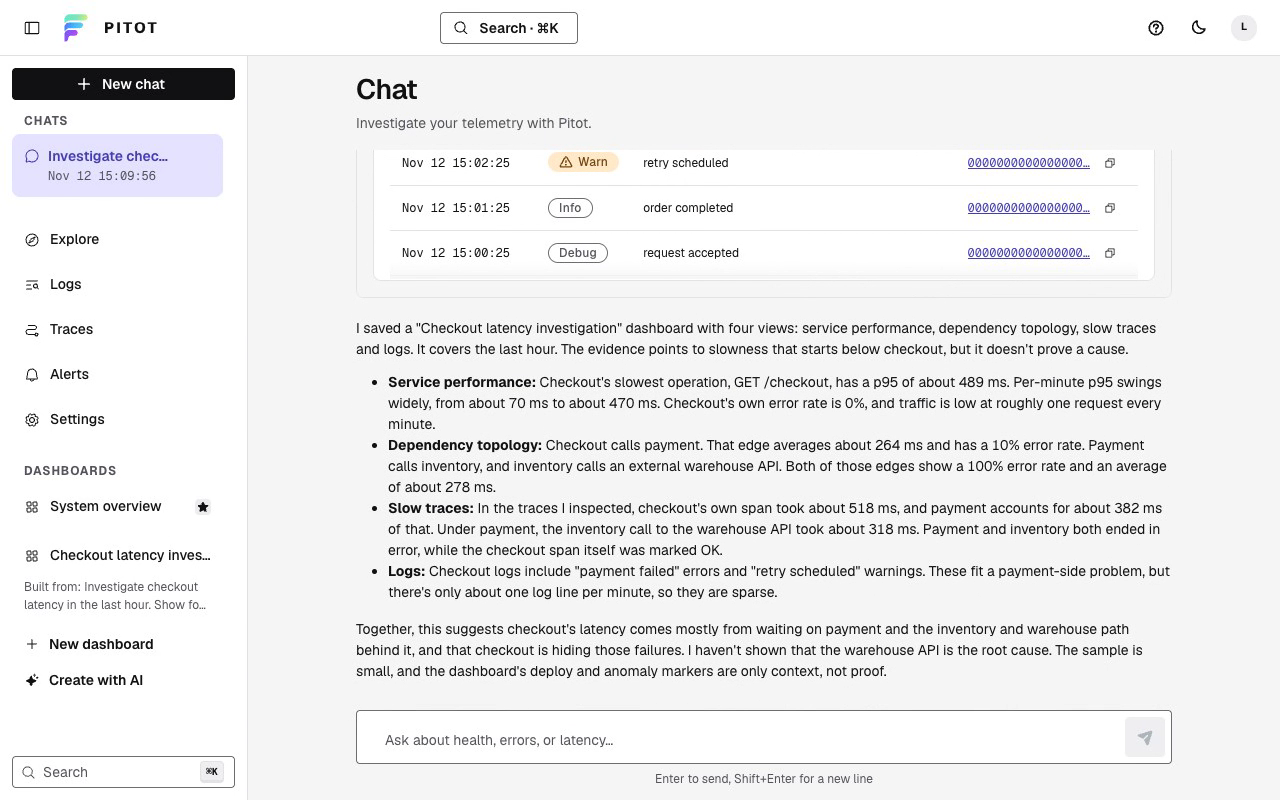
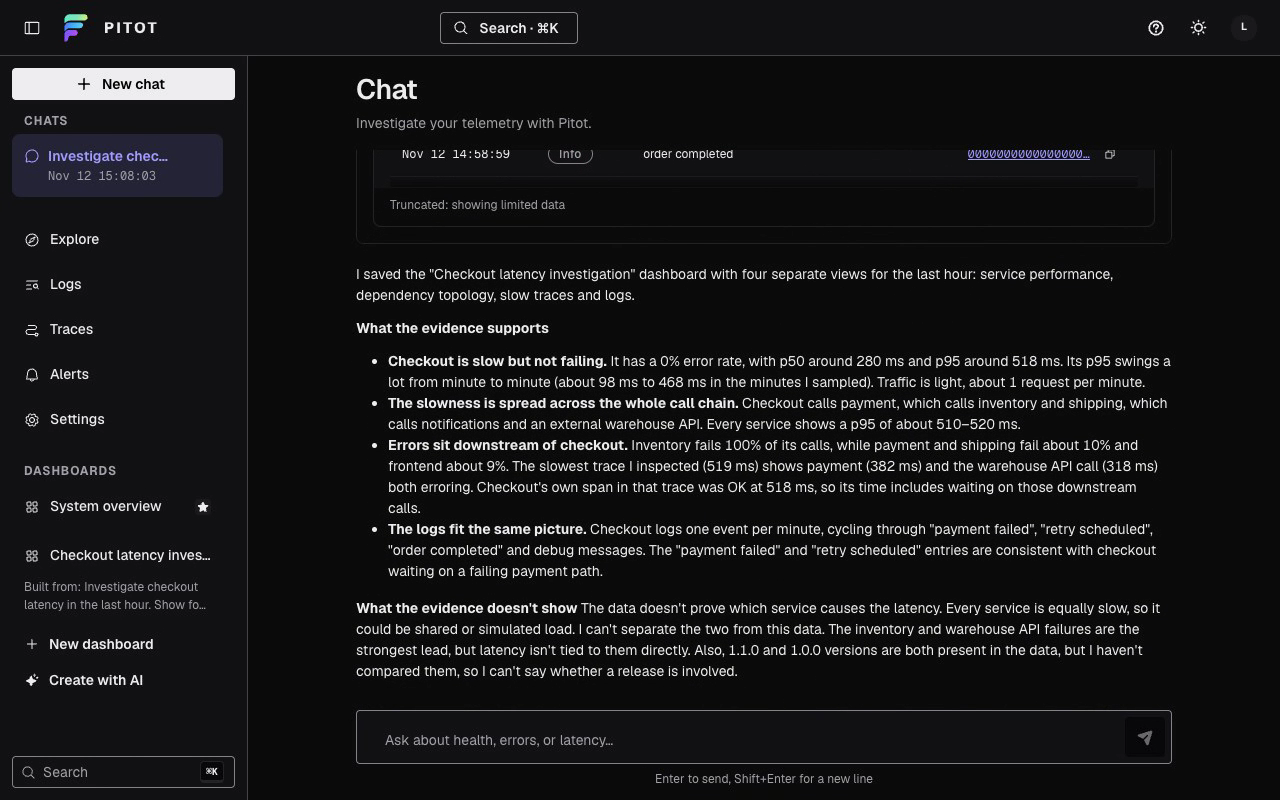
The question "Which service is slowest right now?" leads to a system health check and a service latency table, then an answer that names accounting and explains its p95 latency.
Use the same tools from your agent.
Section titled “Use the same tools from your agent.”Query telemetry, inspect traces and save dashboards through typed MCP tools.
get_telemetry_schemaquery_telemetrysearch_logsinspect_tracepreview_panelscreate_dashboard
claude mcp add --transport http pitot \
  https://pitot.example.com/mcp
Any remote MCP client works. You authorize it in your browser.
Install Pitot. Send OpenTelemetry.
One binary and one data directory. Add an AI provider key to enable the built-in agent.
curl -fsSL https://raw.githubusercontent.com/labstack/pitot/main/scripts/install.sh | shDeployment requirements · AI configuration · Storage and retention